Contents
Introduction
Graphs of motion give us a useful way of expressing the motion of objects. By learning to interpret them accurately, we can unlock a wide range of insights into the journeys objects go on.
In this post, we’re going to familiarise ourselves with some key graphs of motion to understand the meaning behind their shapes and learn to read them with confidence.
Let’s begin!
Space rocket launch
In a vertical space rocket launch, thrust generated by the rocket’s engine lifts the rocket off the launch pad and propels it upwards. Assuming drag is negligible in this initial phase, the rocket takes off with constant, positive (upwards) acceleration.
Velocity increases at a constant rate. So the velocity-time graph is a straight line sloping upwards and, since the rocket was stationary at the start, this line goes through the origin.
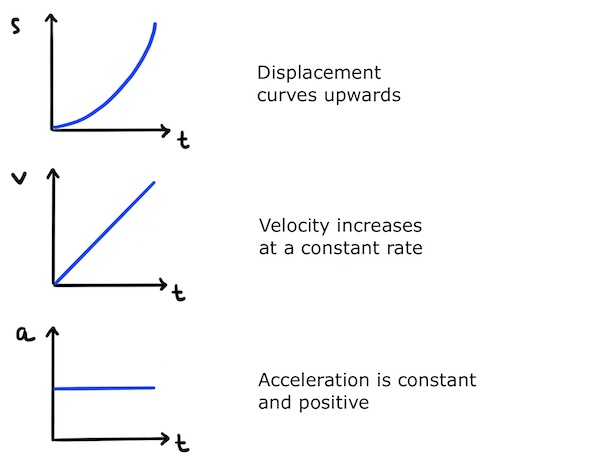
As the launch progresses, the rocket gets faster and faster, so in equal, consecutive time intervals it travels upwards by increasing amounts. This produces an upward curve in the displacement-time graph which is a classic shape (worth remembering!) for an object undergoing constant positive acceleration.
Vehicle journey
Another important scenario to know about is a vehicle travelling along a straight bit of road.
In the following example, the driver puts their foot down in part A to produce a constant, forwards driving force. If we ignore air resistance and other small frictional forces, the journey starts with constant, positive acceleration.
Sound familiar? That’s exactly how the rocket launch started! So in part A, the vehicle’s graphs look the same as the rocket’s.
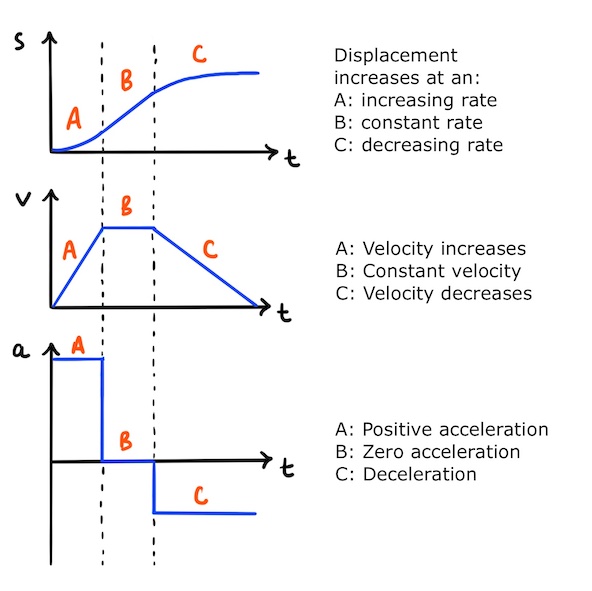
At the end of part A, the driver reaches their preferred velocity and continues at this velocity in part B. Part B is therefore characterised by constant velocity, so acceleration is zero and displacement increases at a constant rate.
In part C, the driver puts the brakes on and the vehicle decelerates. As the vehicle slows down, it approaches its final destination where its velocity reaches zero and its displacement becomes constant.
Cyclist's journey
Let’s explore a cyclist’s journey that has some similarities with the vehicle journey we’ve just seen. In the cyclist’s journey below, parts A to C have the same shape as the vehicle journey: a period of acceleration (A) followed by constant velocity (B) and deceleration to a stop (C).
A period of zero velocity and constant displacement then follows (part D). The cyclist has stopped to admire the view 🙂
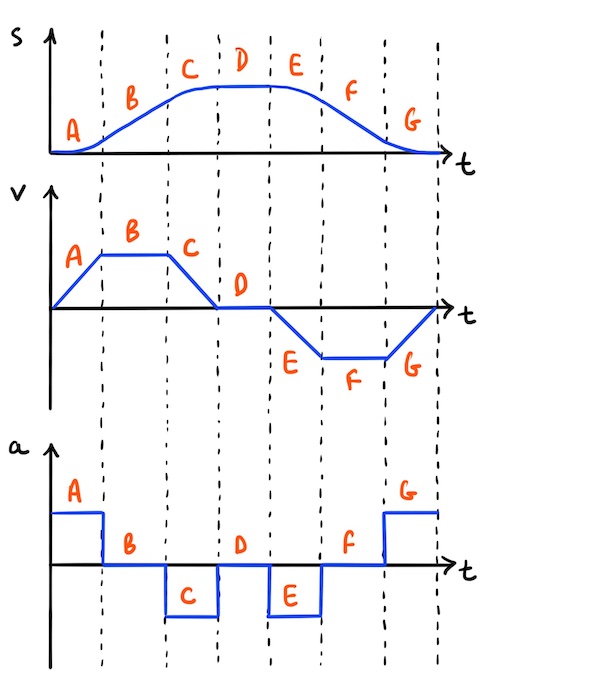
What happens next? It’s parts A to C in reverse!
We have the same pattern of velocity in the second half of the journey except all values are negative. This is because the cyclist is now travelling on the return leg of the journey back towards the starting point.
Accelerations also take opposite signs. For example, in part E the cyclist accelerates back towards the starting point, so this acceleration is negative.
Throughout the return leg, displacement decreases until finally it reaches zero and the cyclist is back where they started.
Throwing a ball straight up and catching it
Throwing a ball straight up and catching it when it falls back down is another classic scenario you need to know.
Ignoring air resistance (which is negligible), the only force acting on the ball in flight is its own weight under gravity. As a result, acceleration is constant and negative.
Velocity therefore decreases at a constant rate.
We also know the initial velocity is high and positive because the ball is traveling upwards, quickly when it’s first released.
The velocity-time graph is therefore a straight line sloping downwards, intercepting the y-axis at a large, positive value.
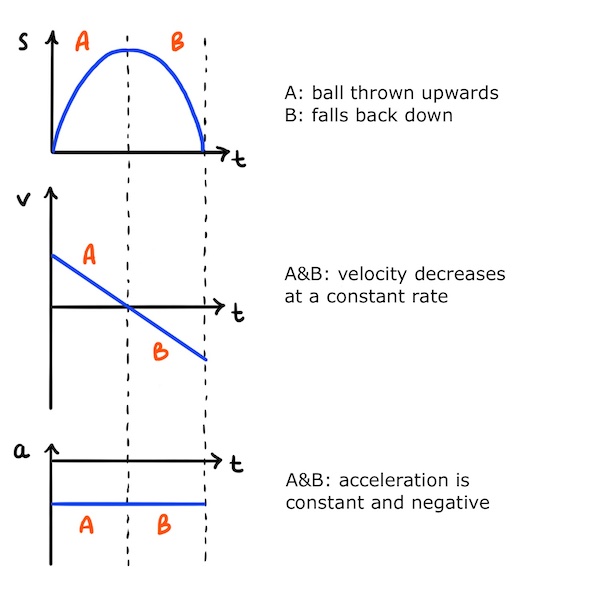
Meanwhile, the ball’s displacement increases rapidly as it initially shoots upwards. As it decelerates, it covers smaller displacements in equal times and the displacement-time graph curves, eventually reaching a gradient of zero.
At this point, the ball has reached its maximum height and has zero velocity. It enters free fall (in part B) and accelerates downwards until, finally, it’s caught back where it started.
Throwing a ball straight up and letting it fall to the ground
If the ball isn’t caught but instead falls further, it will fall below the height from which it was originally thrown. Its displacement becomes negative.

As it continues to accelerate downwards, the magnitude of its velocity continues to increase and it plummets faster and faster towards the ground.
Bouncing ball
Now for something special: when a ball bounces several times on a horizontal surface, the graphs for throwing-a-ball-straight-up-and-catching-it are repeated (again, ignoring air resistance). The result is some pretty cool-looking graphs!
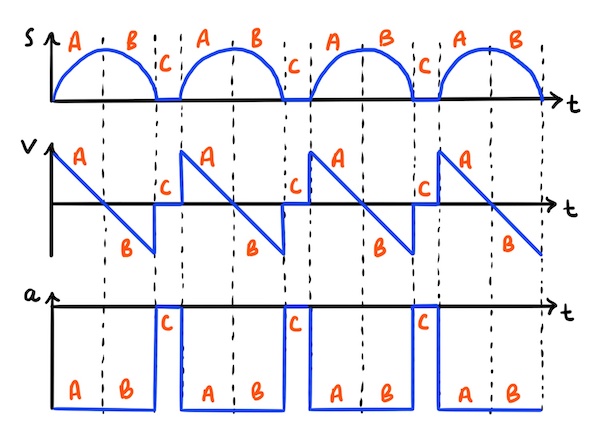
The gaps (part C) are when the ball bounces (by elastically compressing and decompressing) on a surface. This is very quick, so this part is sometimes missed out as a reasonable approximation.
Graphs of scalar quantities of motion
And finally, the scalars: distance and speed.
Since scalars have magnitude only, distance and speed do not change their signs if there is a change in direction.
So speed is always positive. It takes the same values as velocity when velocity is positive and the equivalent positive values when velocity is negative. This produces an interesting V-shape in the thrown ball’s speed-time graph below.

Distance also lacks direction: any motion in a journey (regardless of direction) causes the distance travelled to go up.
So distance increases for the ball when it’s travelling upwards and when it’s falling back down. This creates the lovely S-bend in the distance-time graph above.
Conclusion
I hope you’ve enjoyed these key graphs of motion!
Being familiar with these important graphical shapes and their meanings will help you interpret a wide range of graphs of motion with confidence.
