Contents
Introduction
Starlight contains absorption lines that can tell us which elements are present in the star’s atmosphere.
In this post, we’re going to explore how we can observe changes in these absorption lines caused by the Doppler effect and use these observations to infer that the Universe is expanding.
Let’s begin!
Starlight contains absorption spectra
Stars produce electromagnetic radiation by nuclear fusion. To a good approximation, stars are black body emitters which means they generate a continuous spectrum of electromagnetic radiation. The visible part of this spectrum looks like this:

To reach outer space, light generated inside the star must first travel through the star’s cooler gaseous atmosphere before emerging into space.
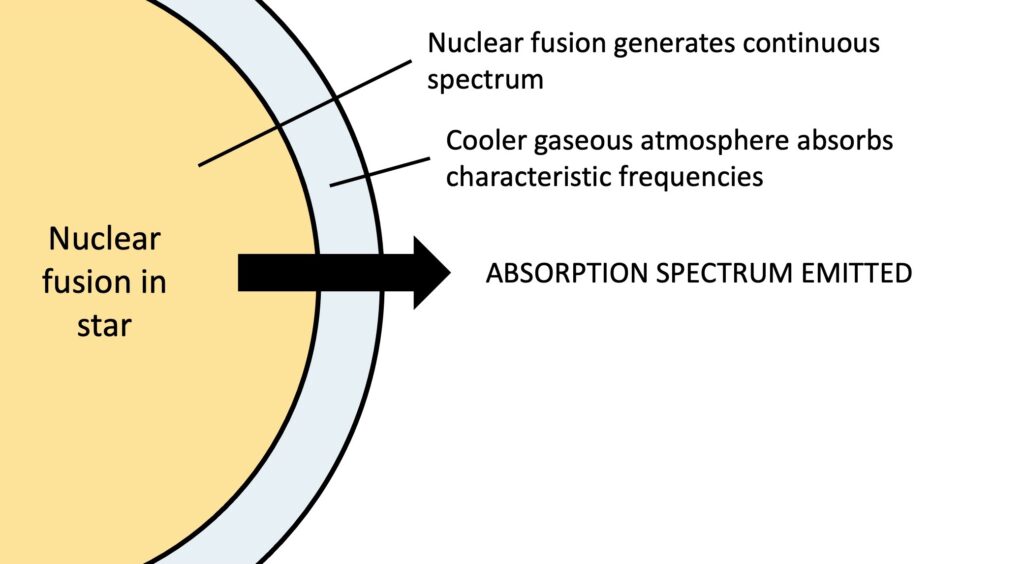
The atmosphere contains gases that absorb certain characteristic frequencies. Although these frequencies are re-emitted, they are re-emitted in all directions so the proportion of light travelling in the original direction is greatly diminished. As a result, the light that leaves the star is effectively missing the characteristic frequencies.
We call the emerging spectrum with characteristic frequencies missing an absorption spectrum.
Absorption spectra are usually shown as missing (black) absorption lines in an otherwise continuous spectrum. For example, the characteristic absorption spectrum of hydrogen looks like this:
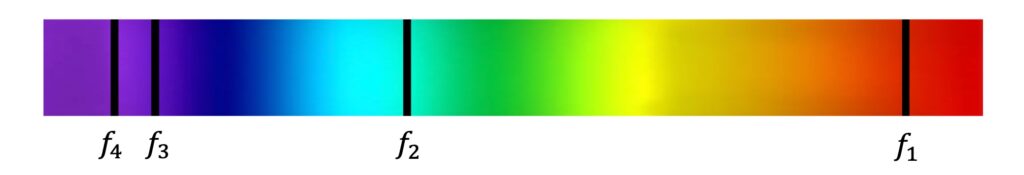
Since the values of the missing frequencies depend on the elements present in the star’s atmosphere, the absorption spectrum acts like a barcode telling us which elements are present in the star’s gaseous atmosphere.
Starlight is subject to the Doppler effect
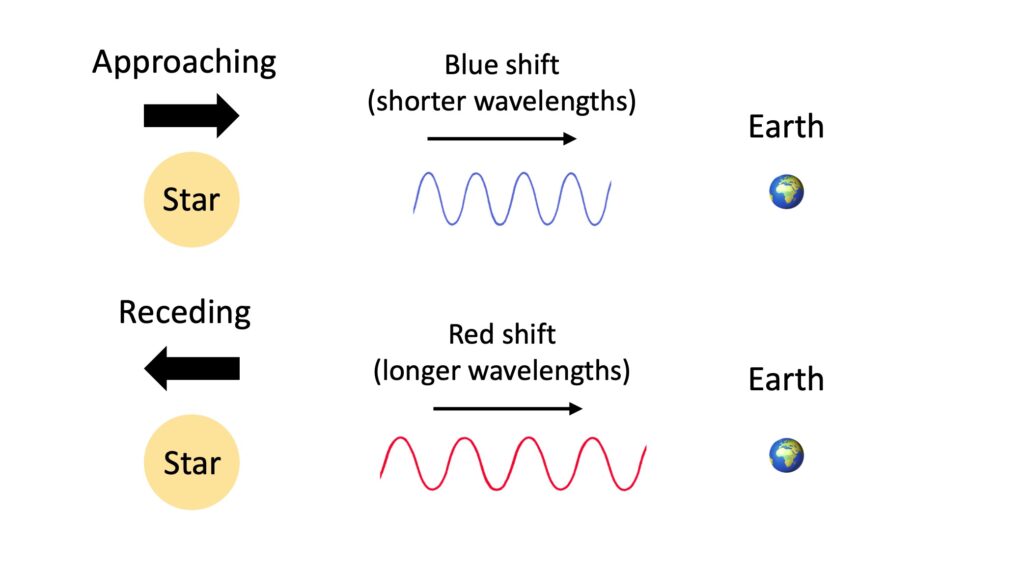
If a star is moving towards us or away from us, its light will be subject to the Doppler effect, just like all waves.
For stars that are approaching us, their light is compressed so that the wavefronts are bunched up closer together. This shortens the wavelengths, increases the frequencies, and shifts the light towards the blue end of the spectrum.
Conversely, for stars that are receding from us, their light is stretched out so that the wavefronts are further apart from each other. This elongates the wavelengths, decreases the frequencies, and shifts the light towards the red end of the spectrum.
Measuring the Doppler shift in starlight
In Doppler shifted starlight, the whole spectrum shifts, including the absorption lines. As a result, we observe absorption lines that are shifted compared to the absorption lines of a stationary sample in the lab.
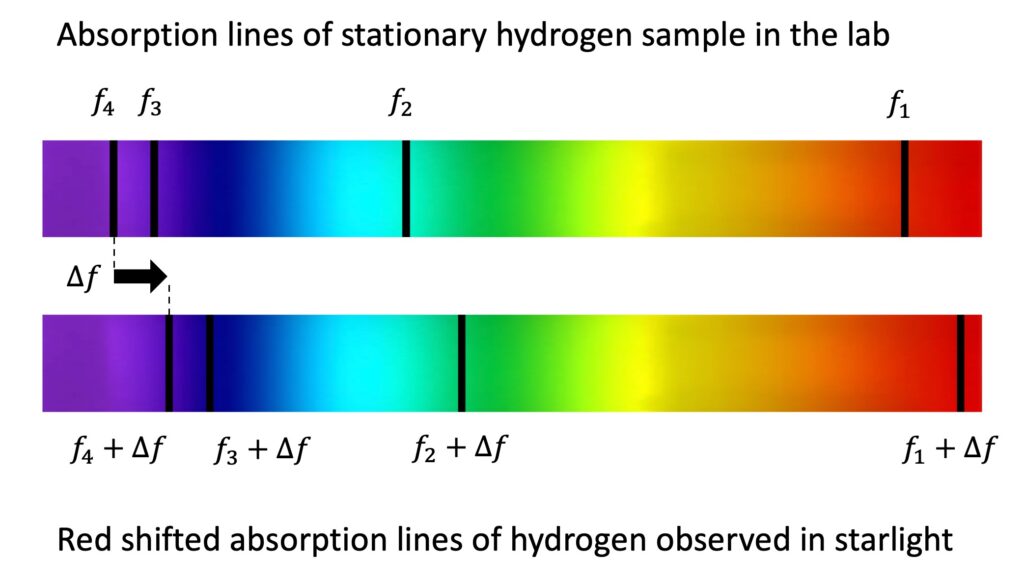
In this example, we can see that the whole characteristic barcode of hydrogen has been red shifted by \(\Delta f\).
We can quantify the amount of red shift, \(z\). It is defined as the change in wavelength compared to the original wavelength emitted by the star:
\(z=\frac{\Delta \lambda}{\lambda}\)
If the speed of recession of the star, \(v\), is much less than the speed of light (\(v\ll c\)), we can also make the following approximations:
\(z=\frac{\Delta \lambda}{\lambda} \approx\frac{\Delta f}{f}\approx\frac{v}{c}\)
This equation enables us to measure either the change in wavelength or the change in frequency of an absorption line compared to the stationary lab sample (which has no Doppler shift) and use this to calculate the red shift. It also enables us to calculate the speed of recession of the star or galaxy from which the starlight came!
Hubble’s law and the expansion of the Universe
Both blue and red shifts have been observed in starlight. This demonstrates that some stars are moving towards us and some are moving away.
It turns out that light from all distant galaxies is red shifted. Scientists have also observed that the velocity of recession of distant galaxies is proportional to their distance from us:
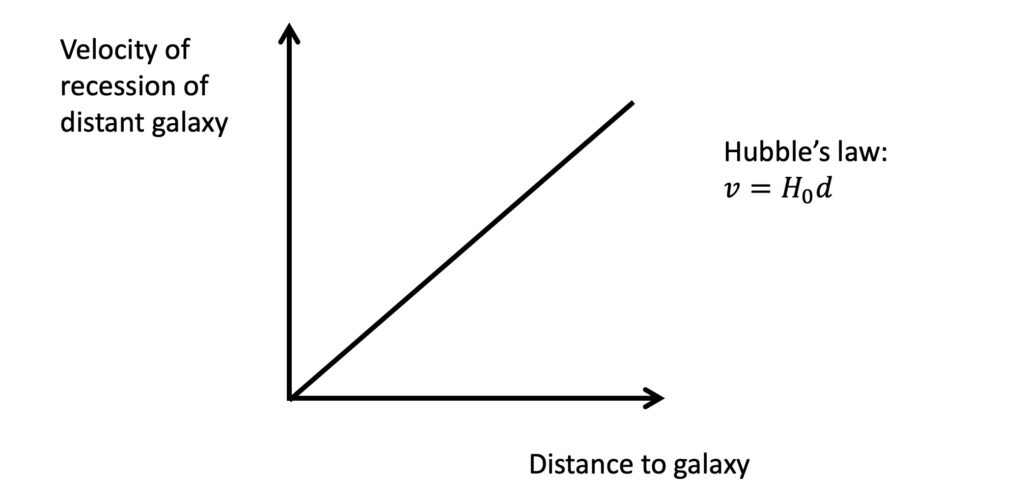
This relationship is known as Hubble’s law, where the constant of proportionality is the Hubble constant, \(H_0\):
\(v=H_0d\)
Since galaxies are receding away from us faster the further away they are, this means the Universe is expanding. As it expands, it takes distant galaxies with it and stretches all electromagnetic radiation and galaxies in the process. This type of red shift of electromagnetic radiation is called cosmological red shift and was discovered by Edwin Hubble in 1929.
A reasonable analogy is to draw dots on a balloon and then blow it up. As you blow up the balloon, the dots will get bigger and further away from each other as the material in which they exist expands!
Conclusion
I hope you’ve enjoyed this post on Doppler shifts in starlight! We have seen how starlight contains absorption spectra which are Doppler shifted if the source is approaching or receding from us. We have also reviewed Hubble’s law and the significance of red shifted light from distant galaxies in our Universe.
If you’ve enjoyed this, you might also enjoy the related topics of atomic energy levels and spectra and stellar radiation!
Happy studying!